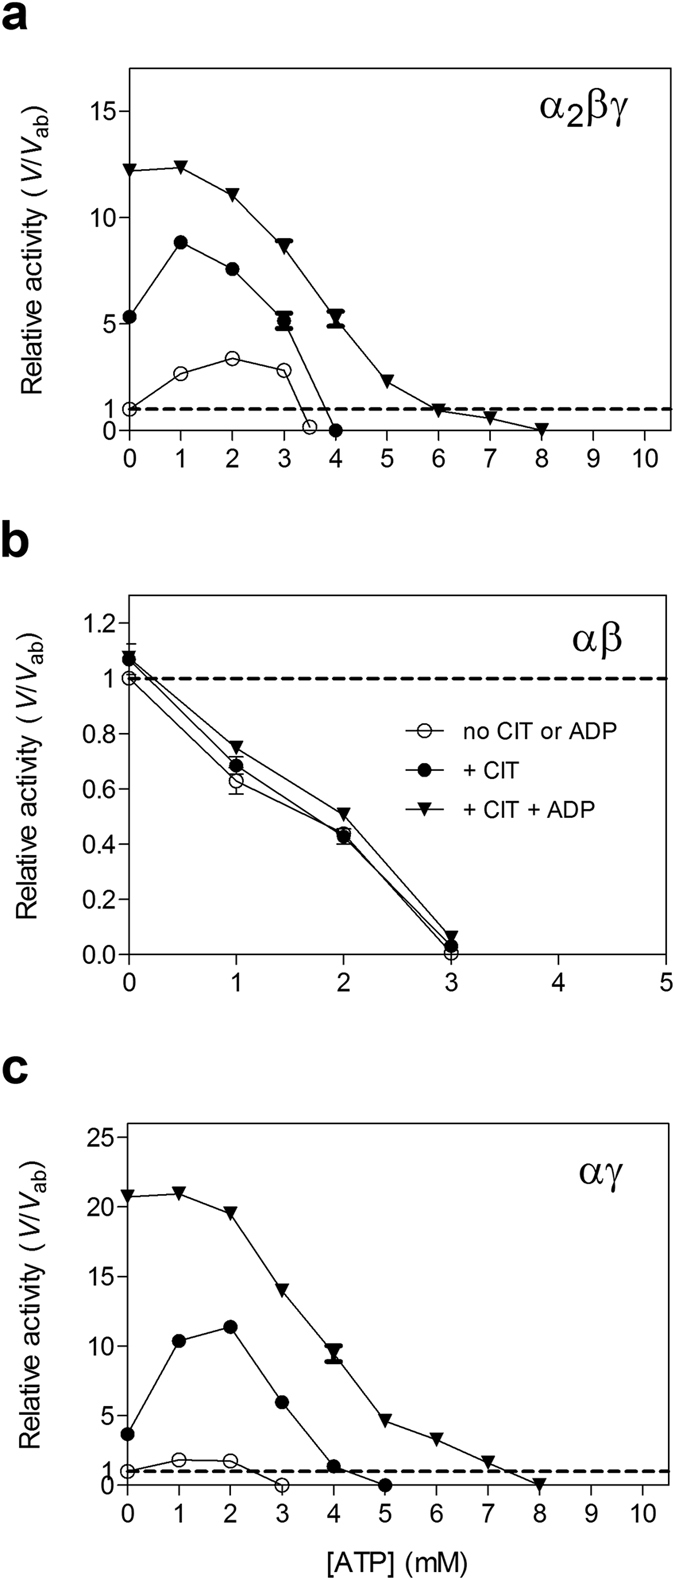
Figure 3. Activation and inhibition effects of ATP.

(a) The relative activity of the α2βγ enzyme vs. the concentration of ATP in the absence or presence of positive regulator(s). (b) The relative activity of the αβ enzyme vs. the concentration of ATP in the absence or presence of positive regulator(s). (c) The relative activity of the αγ enzyme vs. the concentration of ATP in the absence or presence of positive regulator(s). The activities in the absence of any regulators (Vab) are defined as 1 and indicated by dashed lines. The activities were measured at the standard conditions with a subsaturating concentration of ICT (0.6 mM for the α2βγ and αγ enzymes and 2 mM for the αβ enzyme) in the absence or presence of 1 mM CIT or/and 1 mM ADP and varied concentration of ATP (0–10 mM).
