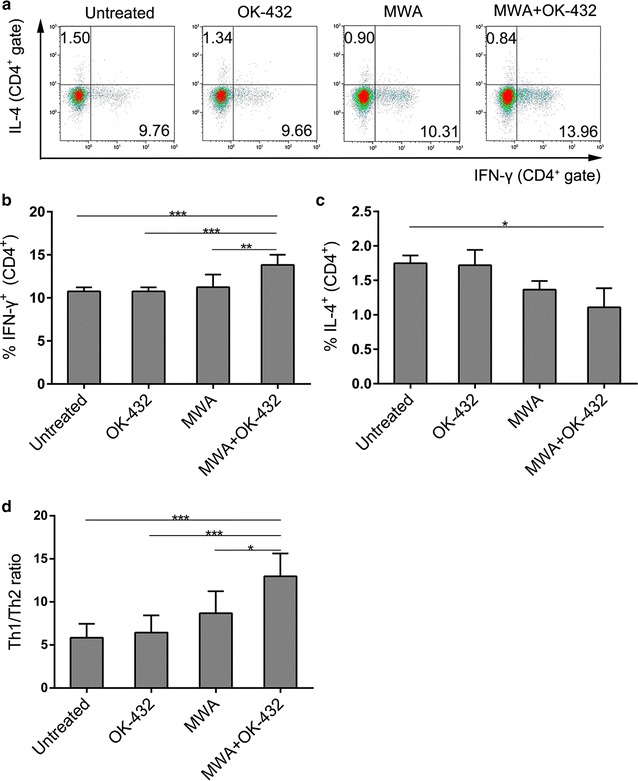
Fig. 5.

MWA plus OK-432 polarized T-cell responses to Th1 dominance. Mononuclear cells were prepared from spleen and stimulated with PMA, ionomycin, and brefeldin A for 5 h before flow cytometric analysis. a Representative flow cytometric plots showing CD4+ IFN-γ+ and CD4+ IL-4+ cells on days 7 after MWA. b, c, the percentage of IFN-γ secreting Th1 and IL-4 secreting Th2 cells in CD4+ Th cells. d The ratio of Th1 to Th2 cells was calculated for each mouse. Column, mean; error bars, SEM. *P < 0.05; **P < 0.01; ***P < 0.001. Data were pooled from two independent experiments with five mice per group
