Fig. 10.

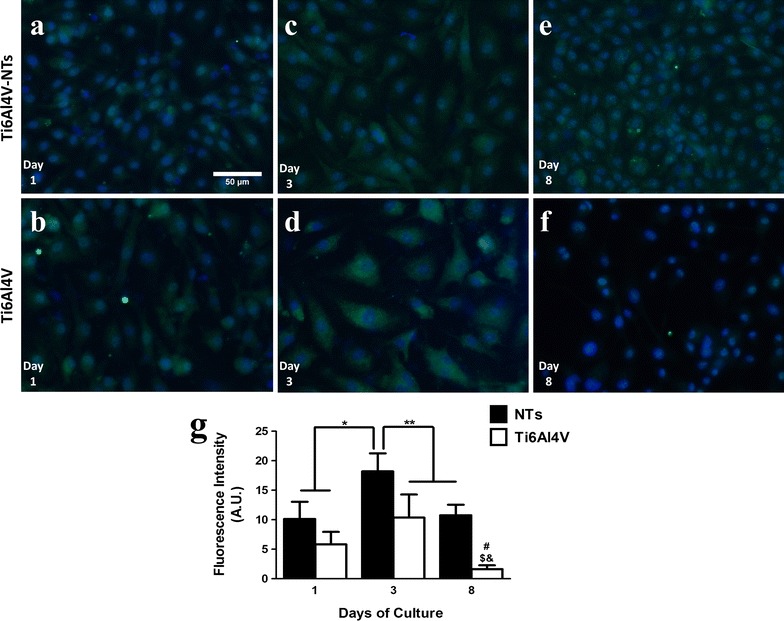
Immunofluorescence of p-eNOS expression in BCAECs cultured on the experimental surfaces. a BCAECs on the NT surface at day 1 of culture; b Ti6Al4V surface with endothelial cells at day 1; c NTs with BCAECs at day 3 of cell growth; d BCAECs on flat Ti6Al4V surface at day 3 of incubation; e NT surface with BCAECs at day 8 of cell seeding; f Ti6Al4V control surface at day 8 of cultivation; and g graph representing the cellular fluorescence intensity expressed for p-eNOS as a function of time. Values are mean ± SD, N = 5. *Denotes differences between NT surface at day 3 versus day 1 of culture on NTs and Ti6Al4V alloy. **Illustrates significant changes for NTs at day 3 compared to Ti6Al4V at day 3 and for the NTs and Ti6Al4V group at day 8 of culture. # Showed remarkable differences for NTs and Ti6Al4V at day 8. $ Represents striking divergences between Ti6Al4V at day 8 and Ti6Al4V at day 3 of growth and demonstrates important contrasts after comparing Ti6Al4V at day 8 versus day 1
