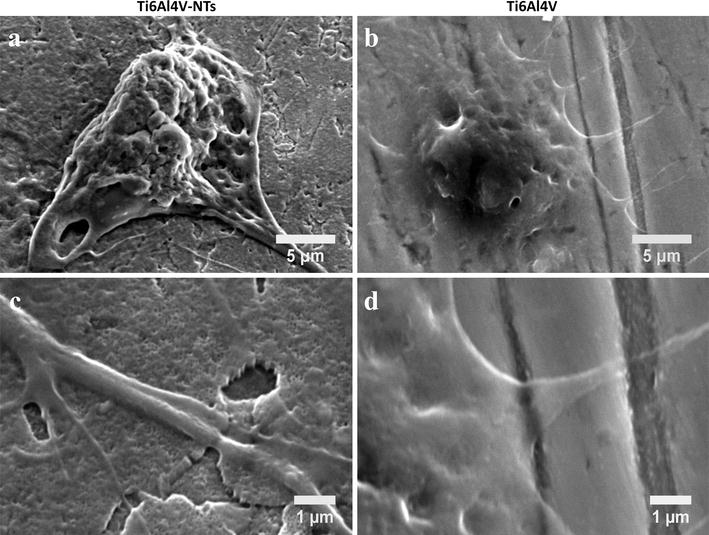
Fig. 7.

SEM analysis showing BCAEC morphology after 4 h of cell culture. a Endothelial cells adhered on the NT surface representing a well-defined cell body; b Ti6Al4V control surface illustrating a poorer filopodia formation; c higher magnification denoting the configuration of a thicker filopodia anchored to the NTs; and d high magnification of Ti6Al4V surface indicating a translucent and impaired filopodia
