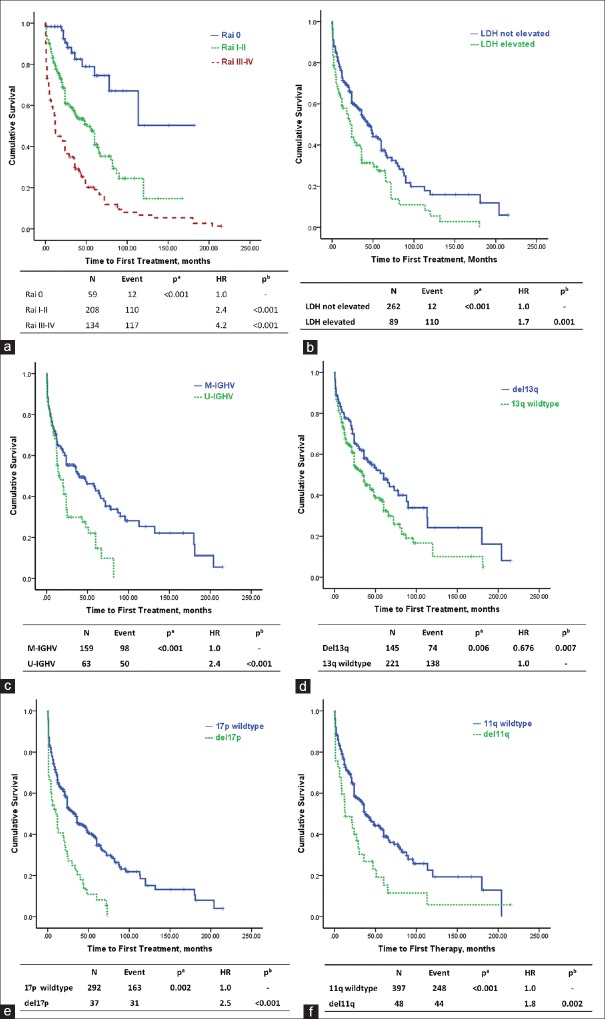
Figure 1.
Kaplan-Meier curves for TTFT according to cytogenetic abnormalities, immunoglobulin heavy chain variable region (IGHV) mutational status and lactate dehydrogenase (LDH) level. Pa is the value calculated by log-rank test for differences in variables and Pb value is calculated by Cox multivariate analysis for differences in variables. (a) Kaplan-Meier curves for TTFT according to Rai staging system. (b) Kaplan-Meier curves for TTFT according to LDH. (c) Kaplan-Meier curves for TTFT according to IGHV mutational status. (d) Kaplan-Meier curves for TTFT according to 13q. (e) Kaplan-Meier curves for TTFT according to 17p. (f) Kaplan-Meier curves for TTFT according to 11q.

