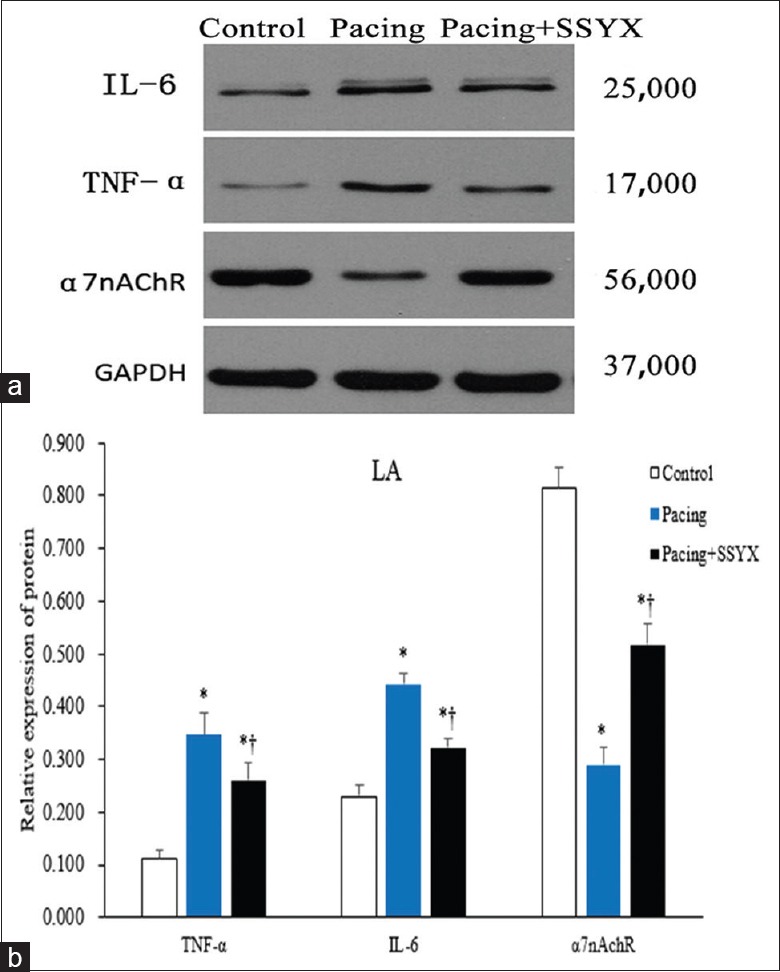
Figure 6.

Western blot results of protein samples extracts from the LA. Representative images of Western blot results for IL-6 with a specific band at 25,000, for TNF-α with a specific band at 17,000, for α7nAchR with a specific band at 56,000 Western blot results analyses were performed for control, pacing, and pacing + SSYX groups. Antibodies for GAPDH with a specific band at 37,000 were used as a reference. (b) Statistical chart of Western blot results of LA. *P < 0.001 versus control group; †P < 0.001, pacing + SSYX group versus pacing group. IL-6: Interleukin-6; TNF-α: Tumor necrosis factor-alpha; α7nAChR: α7 nicotinic acetylcholine receptor protein; GAPDH: Glyceraldehyde-3-phosphate dehydrogenase; LA: Left atrium; SSYX: Shensong Yangxin.
