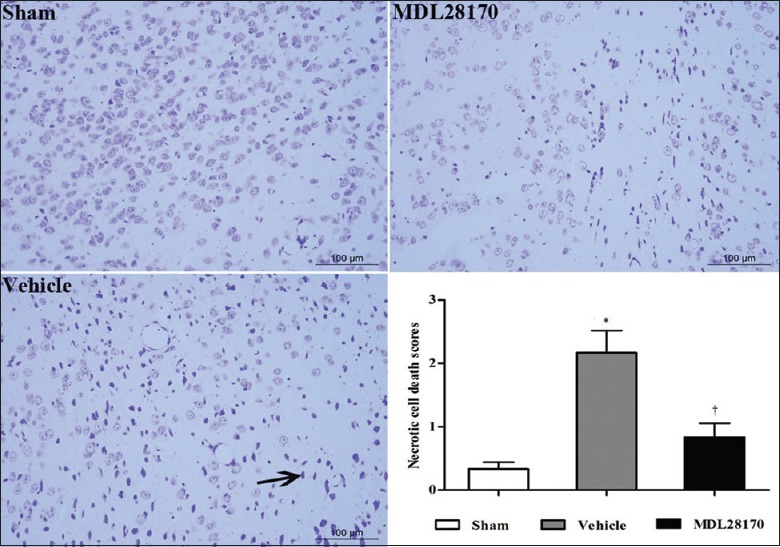
Figure 7.

MDL28170 decreases the necrotic cell death. Representative images of necrotic cell death as shown by cresyl violet staining. Black arrowheads indicate reduced Nissl bodies or cellular structure as well as increased leukocyte infiltration. The bar graph presents the necrotic cell death score; n = 8. *P < 0.05 compared with the sham group. †P <0.05 compared with the vehicle group.
