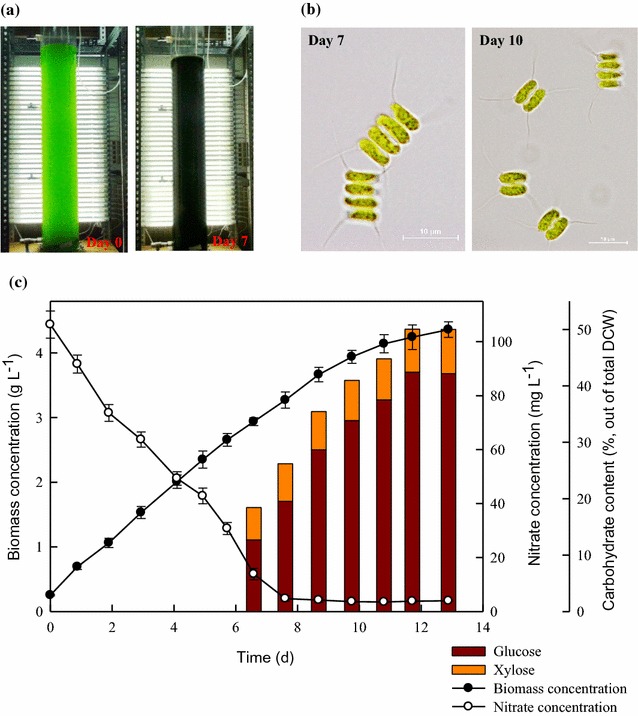
Fig. 3.

Time-course profiles of biomass concentration, nitrate concentration, carbohydrate content, and carbohydrate profile during the growth of S. obliquus CNW-N under indoor large-scale cultivation. Error bars indicate standard deviation of three replicated experiments. (Light intensity = 500 μmol m−2s−1; CO2 feeding concentration = 2.5%; working volume = 60 L.) a Indoor PBR with external light. b Microscopy of S. obliquus CNW-N. cTime-course growth of S. obliquus CNW-N under indoor large-scale PBR
