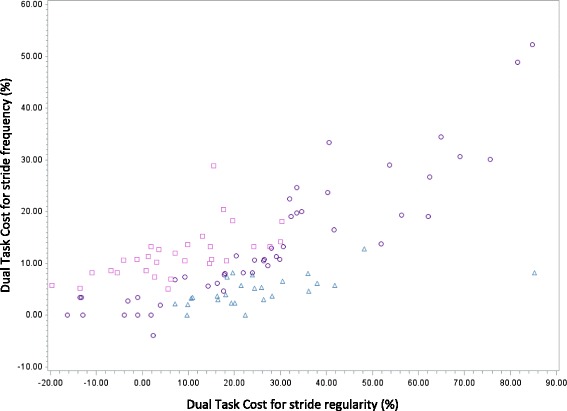
Fig. 2.

Motor phenotypes identified on the basis of quartile analysis of Dual Task Cost for Stride Frequency and Stride Regularity (KW <0.01, r = 0.69, p < 0.0001).  High value of DTC for Stride Frequency—Low value of DTC for Stride Regularity (n = 30). N°2:
  Same value of DTC for Stride Frequency and Regularity (n = 47). N°3:
  Low value of DTC for Stride Frequency—High value of DTC for Stride Regularity (n = 26)
