Fig. 6.

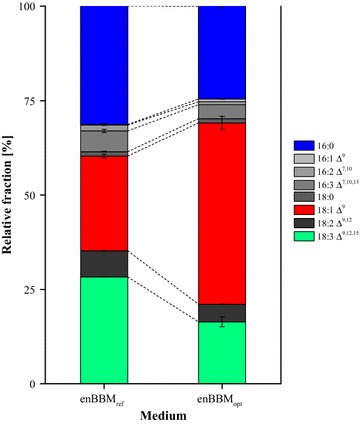
Relative composition of the fatty acids from the neutral lipid product fractions for enBBMref and enBBMopt. Error bars represent min/max from biological replicates (n = 2)

Relative composition of the fatty acids from the neutral lipid product fractions for enBBMref and enBBMopt. Error bars represent min/max from biological replicates (n = 2)