
Fig. 1.
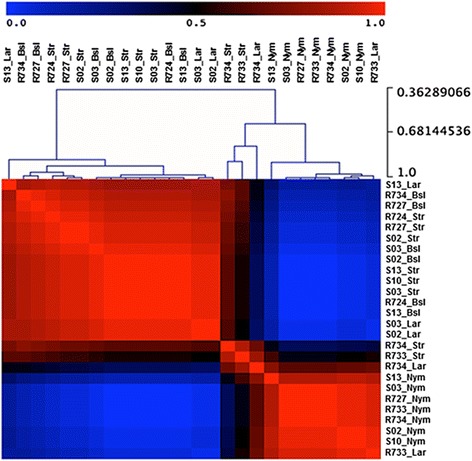
Clustering of all 26 bovine skin samples using Non-negative Matrix Factorization. The data matrix for calculation used intensity values (RMA normalized) for the 1,131 unique differentially expressed genes found across 12 pairwise comparisons (Additional file 5: Table S2). The length of branches in hierarchical tree indicates the degree of similarity between objects (gene expression profiling among the samples) (Cophenetic correlation = 0.86, the highest obtained during analysis), regarding types of experimental groups from which samples are derived and intensity of gene expression. Side scale varying from 0.36 to 1 represents the node height (cluster-to-cluster correlation values). Color bar indicates the degree of correlation where transition from blue to red means low to high correlation, respectively. Abbreviations: S, tick-susceptible hosts; R, tick-resistant hosts; Bsl, baseline skin; Str, stressed skin; Lar, larvae-infested skin; Nym, nymph-infested skin