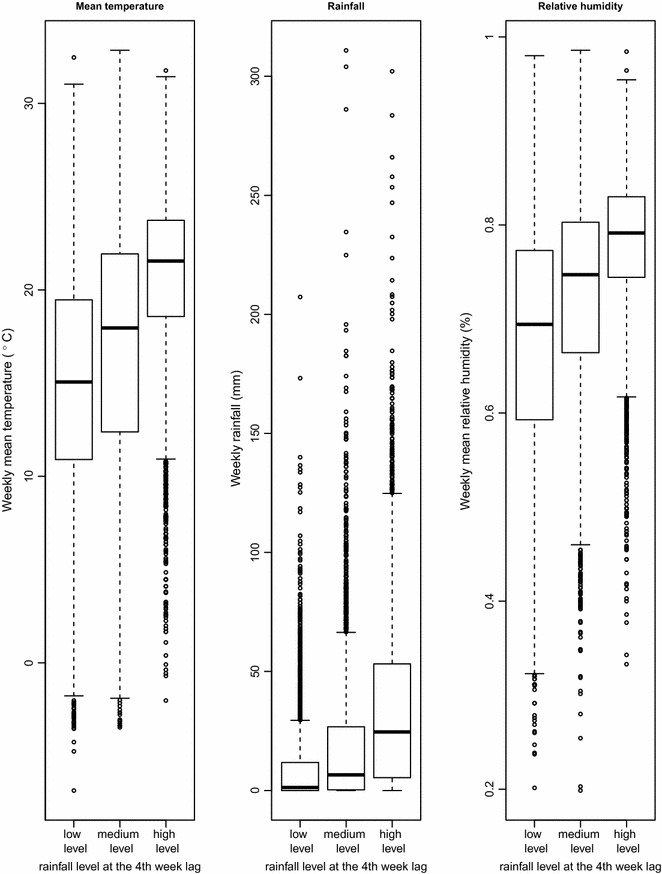
Fig. 1.

Box plot comparison of meteorological variables between three rainfall levels at the fourth week lag. The dark line in the middle of the boxes is the median value; the bottom and top of the boxes indicates the 25th and 75th percentile, respectively; whiskers represent 1.5 times the height of the box; dots with numbers represent the value of outlier cases
