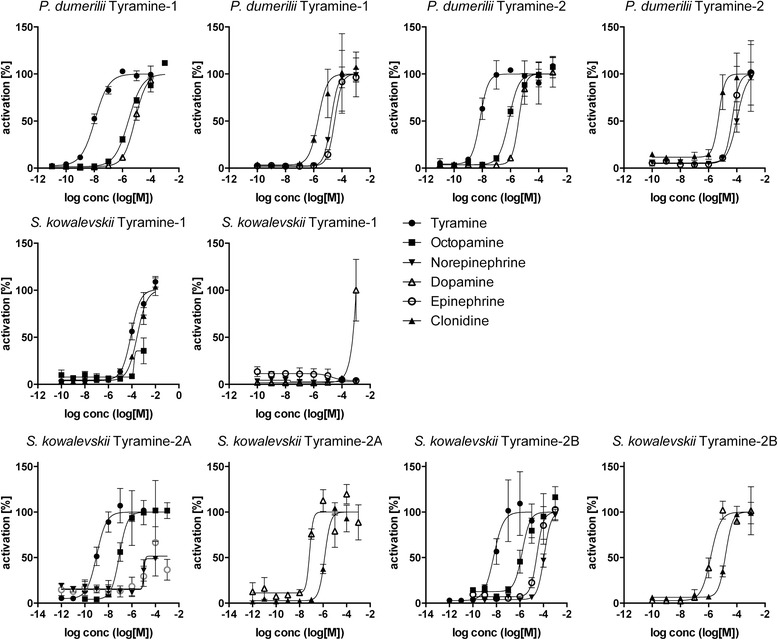
Fig. 3.

Dose–response curves of tyramine G-protein-coupled receptors from Platynereis dumerilii and Saccoglossus kowalevskii treated with varying concentrations of ligand. Data, representing luminescence units relative to the maximum of the fitted dose–response curves, are shown as mean ± standard error of the mean (n = 3). EC50 values and significance values are listed in Table 1
