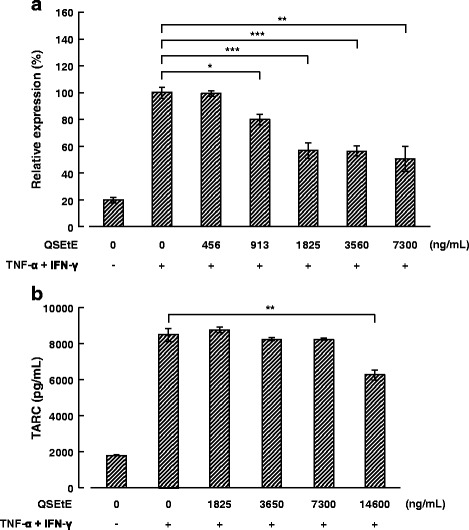
Fig. 6.

Effect of QSEtE on TNF-α- and IFN-γ-induced TARC expression and production of HaCaT cells. a TARC mRNA expression in HaCaT cells treated with TNF-α and IFN-γ (each 10 ng/mL) for 6 h. The expression of mRNA was measured using quantitative reverse transcription-polymerase chain reaction. Values are expressed as the mean ± standard deviation of three independent experiments. *P < 0.05, **P < 0.01, and ***P < 0.001 (Student’s t-test). b TARC production in the culture supernatant of HaCaT cells treated with TNF-α and IFN-γ (each 10 ng/mL) for 24 h. Concentrations of TARC were measured using sandwich enzyme-linked immunosorbent assay. Values are expressed as the mean ± standard deviation of three independent experiments. **P < 0.01 (Student’s t-test)
