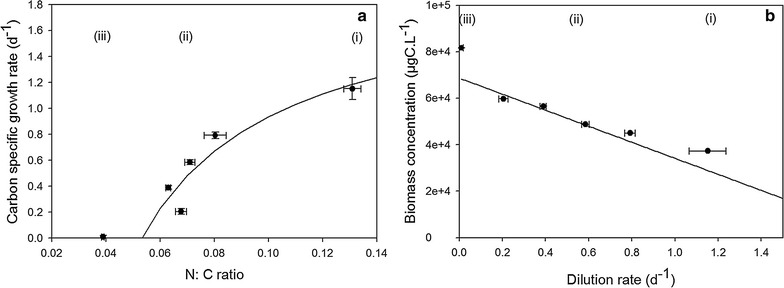
Fig. 3.

a Carbon-specific growth rate as a function of the nitrogen quota (N:C) measured at steady state for different dilution rates and fitted to the Droop equation (Eq. 5; black line). b Steady-state algal carbon concentrations measured (black symbols) and calculated with Eq. 7 (black line). Three phases can be distinguished (i) N-replete, (ii) N limitation, and (iii) N starvation
