
Fig. 1.
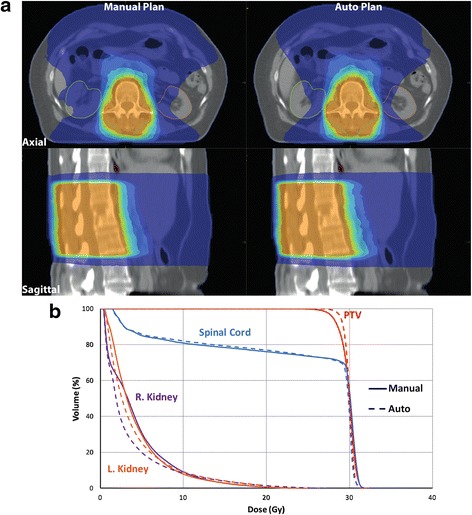
a Dose distribution of a treatment plan on thoracolumbar level (T12-L2). The patient had metastatic breast cancer; irradiation dose applied with this plan was 30 Gy in 10 fractions. Manual plan shown on the left and auto plan on the right. b Dose-volume histogram at the same thoracolumbar level, continuous line represents manual plan, and dotted line represents auto plan