Fig. 4.

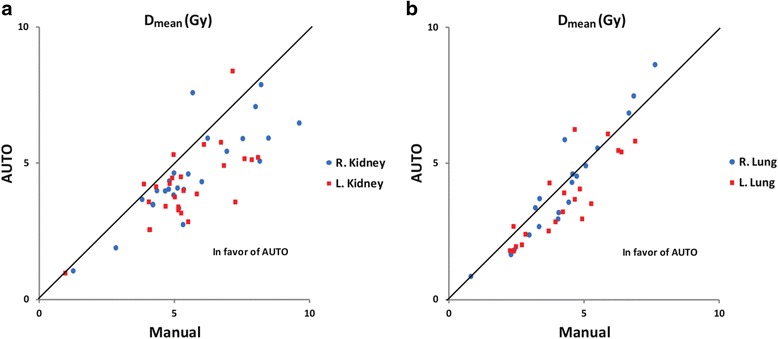
Comparison of mean dose to OARs. Each marker represents the mean dose in the manual plan vs. the auto plan to the kidneys (a) and to the lung (b). For data points right of the unity line, auto-planning yielded better sparing of OARs

Comparison of mean dose to OARs. Each marker represents the mean dose in the manual plan vs. the auto plan to the kidneys (a) and to the lung (b). For data points right of the unity line, auto-planning yielded better sparing of OARs