Fig. 4.

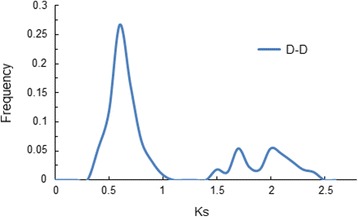
Frequency distribution of Ks values of segmental duplicated gene pairs in G. raimondii. The x axis denotes the Ks value. The y axis denotes the relative frequency

Frequency distribution of Ks values of segmental duplicated gene pairs in G. raimondii. The x axis denotes the Ks value. The y axis denotes the relative frequency