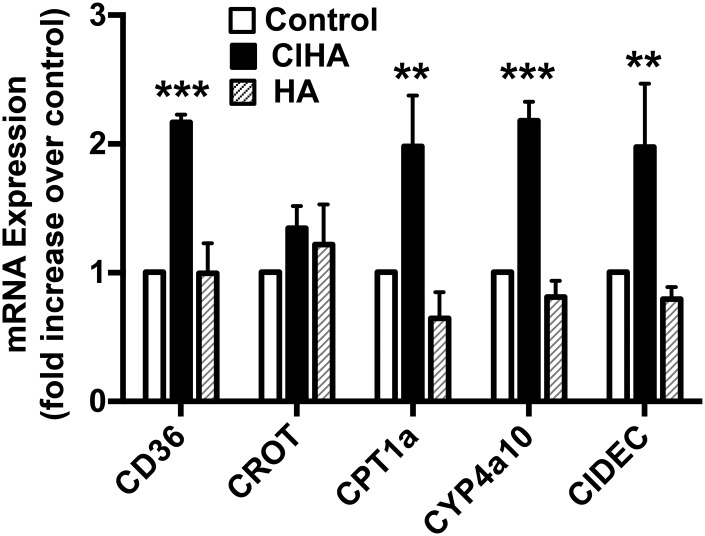
Fig. 6.
Increased expression of PPAR-α mRNA targets in the presence of 2-ClHA. The expression level of PPAR-α target genes is compared between primary mouse hepatocytes treated with either 20 μM HA or 20 μM 2-ClHA. Values represent the mean ± SEM with n = 4–5. **P < 0.01 and ***P < 0.001 versus control. For comparison, fold-increases for WY 14643 in CD36, carnitine-O-octanoyl transferase (CROT), Cpt1a, Cyp4a10, and CIDEC were 6.3 ± 1.2, 2.1 ± 0.4, 3.3 ± 0.9, 5.3 ± 0.5, and 3.5 ± 0.4, respectively (mean ± SEM).

