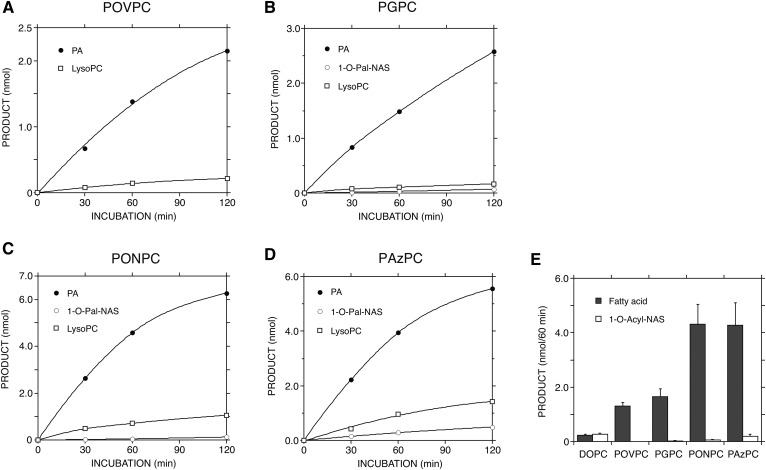
Fig. 4.
Reaction profiles of truncated ox-PCs by LPLA2. The reaction products of truncated ox-PCs by LPLA2 shown in Fig. 3 were quantified by scanning the plate, as described in the Materials and Methods, and plotted against the incubation time (A–D). In addition, liposomes consisting of DODPC/DOPC or truncated ox-PC/NAS (2.4:1:1.05, molar ratio) were incubated with the enzyme for 60 min at 37°C, as shown in Figs. 2, 3. The reaction products were extracted and separated with a HPTLC plate using a solvent system consisting of chloroform/acetic acid (9:1, v/v), as described in the Materials and Methods. The reaction products, long-chain fatty acid, and 1-O-acyl-NAS were plotted against the substrate (E). Error bars indicate standard deviation (n = 3).

