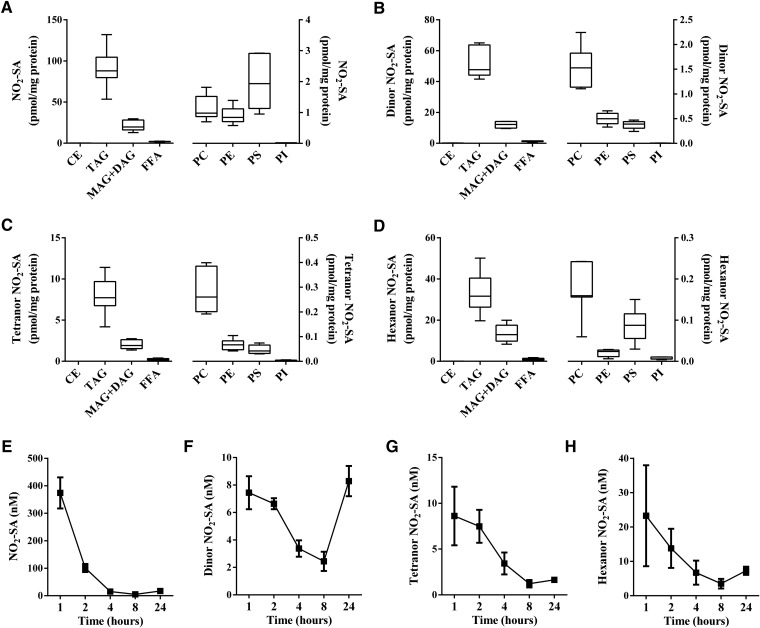
Fig. 3.
Distribution and metabolic profile of NO2-SA in NO2-SA-supplemented adipocyte lipids and media. Adipocyte content (picomoles per milligram protein) of NO2-SA (A), dinor NO2-SA (B), tetranor NO2-SA (C), and hexanor NO2-SA (D) at 24 h after acid hydrolysis of fractionated lipid classes. FFA fraction was analyzed without hydrolysis. Time-dependent concentration changes in media of NO2-SA and its metabolites (E), dinor NO2-SA (F), tetranor NO2-SA (G), and hexanor NO2-SA (H). Range (minimum-maximum) and mean (A–D) and mean ± SD (E–H) are shown. Two independent experiments were performed (n ≥ 3).

