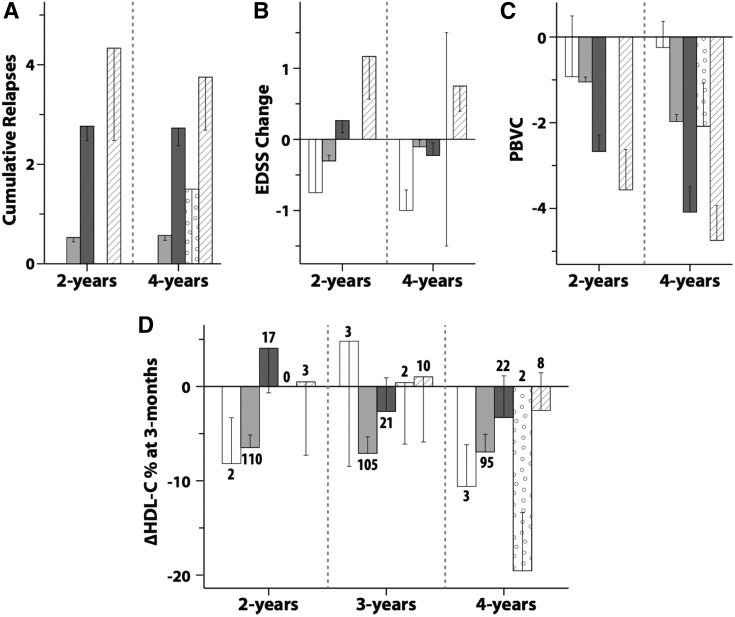
Fig. 3.
Mean values of cumulative relapses (A), EDSS change (B), and PBVC (C) at 2 years and at 4 years, and mean ΔHDL-C% at 3 months (D) at 2, 3, and 4 years for each treatment change group. The patients who switched to no treatment are shown with white bars, patients remaining on once-weekly IFN-β1a are in light gray bars, patients who switched to subcutaneous IFN-β are in dark gray bars, patients who switched to glatiramer acetate are in spotted bars, and patients who switched to natalizumab and other treatments are in striped bars. The number shown against each bar in (D) is the number of patients in that treatment change group. The error bars are standard errors.

