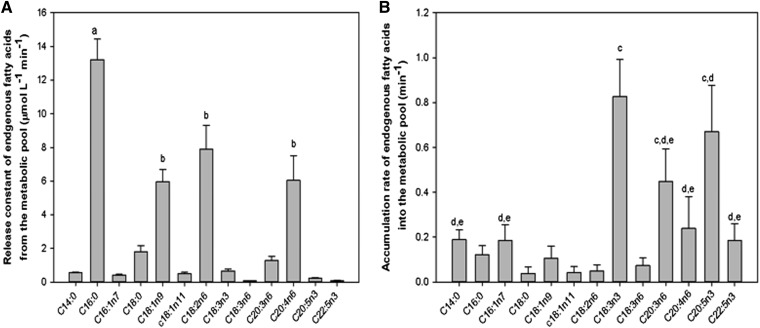
Fig. 6.
Endogenous fatty acid model parameter estimation for the metabolic pool pathway. A: Metabolic pool release pathway rate constant (kr0,endo, μmol/l/min). The substrates labeled “a” differed from the rest of the endogenous fatty acids (P < 0.01). B: Metabolic pool accumulation pathway constant (ka, per minute). Substrates labeled “a” differ from the rest of the endogenous fatty acids. Substrates labeled “b” differ from the rest of the endogenous fatty acids but not within the same group (P < 0.01). Substrates labeled “c,” “d,” and “e” differed from the rest of the endogenous fatty acids but not within the same group (P < 0.01). All values are expressed as mean ± SEM (n = 6).

