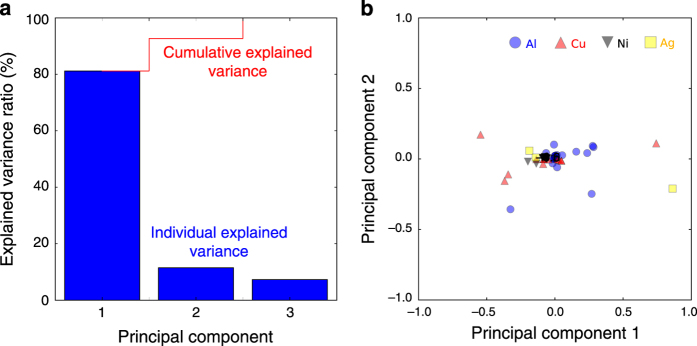
Figure 8. The results of the principal component analysis for the relative error of the elastic coefficients of the four FCC elements Al, Cu, Ni, and Ag show.
(a) the explained variance for the three components and (b) the data transformed in the principal components and projected onto the first two components. The first eigenvector dominates the variance in the data.

