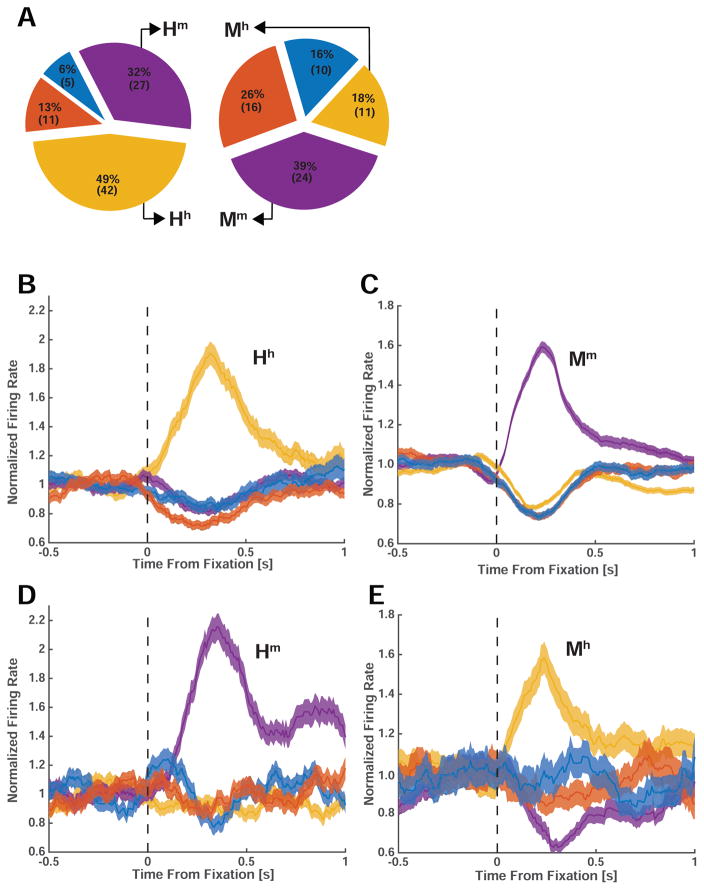
Figure 3. Population analysis and cross-species comparison of fixation-related visual category-selectivity.
(A) Preferred stimulus of all recorded visually selective cells in human (left) and monkey (right) amygdala. The largest proportion of neurons responded maximally to faces of conspecifics: 49% (N=42) and 39% (N=24) of selective neurons in humans and monkeys, respectively. (B–E) Average normalized PSTHs of the four groups of face cells we identified (Hh, Mm, Hm, Mh). The middle row (B,C) shows neurons selective for conspecifics in humans (left, Hh, N=42) and monkeys (right, Mm, N=24). The bottom row (D,E) shows cells selective for heterospecifics in humans (left, Hm, N=27) and monkeys (right, Mm, N=11). Errorbars are ±s.e.m. across cells. Notation: Hh = human cell selective for human faces; Hm = human cell selective for monkey faces; Mm = monkey cell selectively for monkey faces; Mh = monkey cell selective for human faces.

