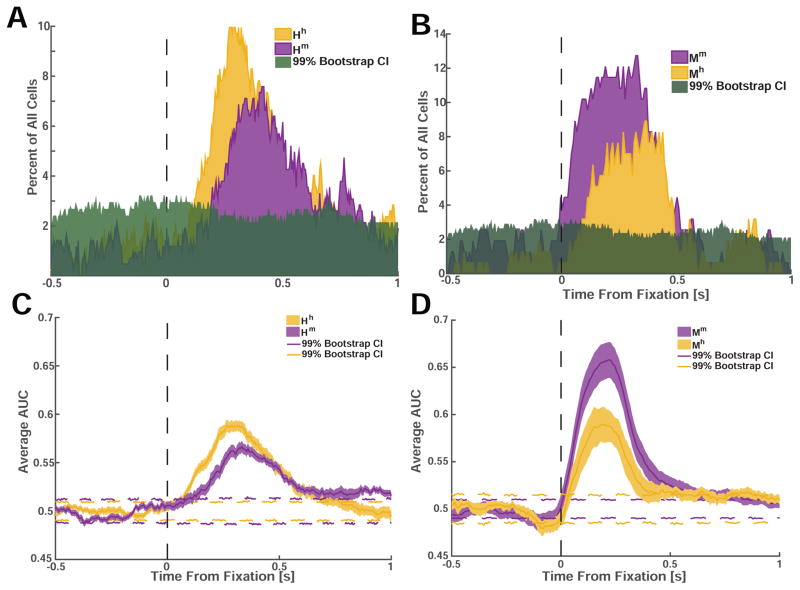
Figure 6. Face cells responded earlier and more strongly to conspecific compared to heterospecific faces.
(A) Proportion of all recorded cells in humans (out of N=422) selective for fixations on conspecific (Hh, yellow) and heterospecific faces (Hm, purple). Green shading indicates the 99% confidence interval. (B) Proportion of all recorded cells in monkeys (out of N=195) selective for fixations on conspecific (Mm, purple) and heterospecific (Mh, yellow) faces. (C,D) Average AUC as a function of time. Dotted colored lines indicate the 99% confidence interval.

