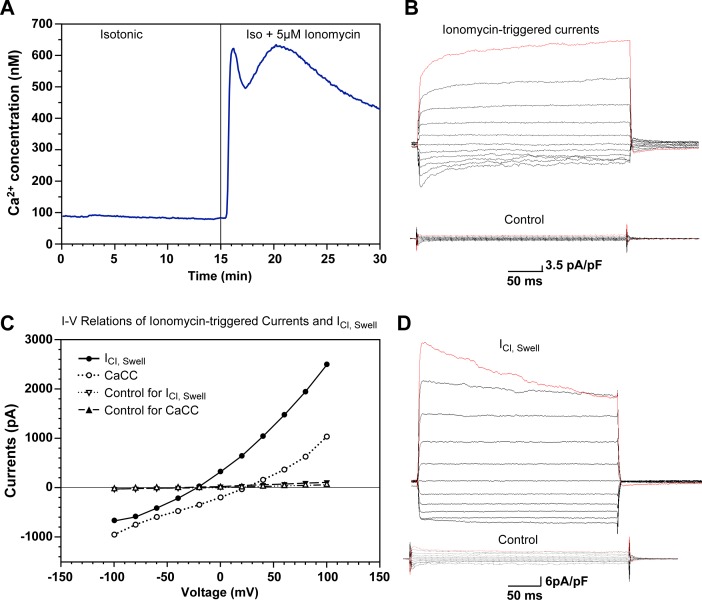
Figure 2.
Effects of ionomycin and hypotonicity on TM-cell currents. (A) Displays the response of the free intracellular Ca2+ to perfusion with 5 μM ionomycin. (B) Presents representative traces of baseline whole-cell perforated patch currents and currents measured 3 minutes after perfusing the TM5 cell with ionomycin. The currents are the responses to clamping the membrane potential at test pulses from +100 to −100 mV at decrements of 20 mV from a holding potential of 0 mV. The peak current reached 1647 pA at +100 mV, the nadir was −963 pA at −100 mV, and the membrane capacitance was 28 pF. The reversal potential was +25 mV, far from the Cl− Nernst potential of −39 mV and consistent with activation of net cation inflow. (D) Illustrates representative baseline currents and swelling-activated (ICl,Swell) currents 10 minutes after initiating hypotonic perfusion in another TM5 cell. The peak current reached 2491 pA at +100 mV, the nadir was −721 pA at −100 mV, and the membrane capacitance was 51 pF. The reversal potential was −21 mV, consonant with activation of net anion inflow. (C) Presents the current-voltage relationships for the experimental and baseline traces of (B) and (D), measured 14 msec after the application of the test pulses.

