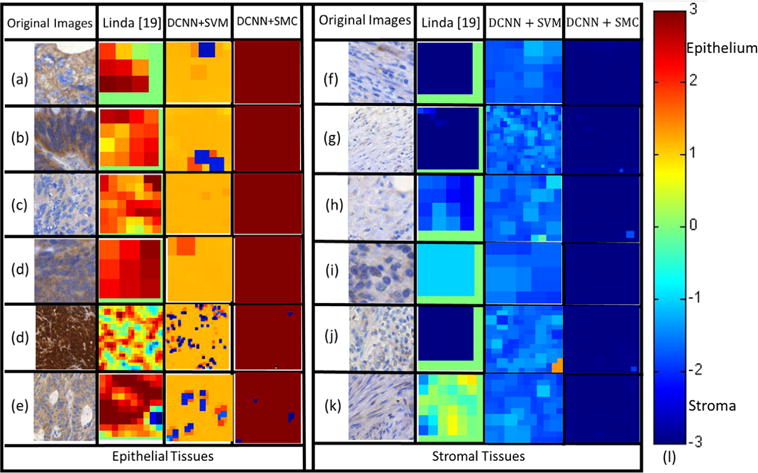
Fig. 4.

The probability maps rendered by the different DCNN based approaches (Columns 3 and 4) and [19] (in Column 2) for classifying EP ((a)–(e) in the left block, Column 1) and ST ((f)–(k) in the right block, Column 1) patches on D2. The false-color (defined by the heat map (l)) of sub-images in Columns 2–4 reflect the confidence score in predicting them as EP/ST regions via Linda [19], DCNN+SVM, and DCNN+SMC, respectively. The various colors in the heat map (l) correspond to the predicted confidence scores (red=EP with 100% likelihood and blue=ST with 100% likelihood). (For interpretation of the references to color in this figure caption, the reader is referred to the web version of this paper.)
