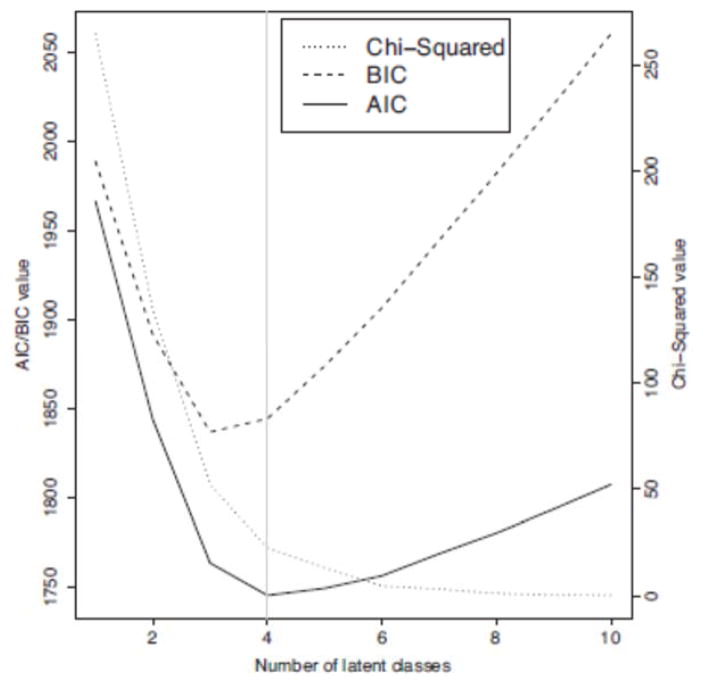
Figure 2.
Fit indices as a function of number of latent classes. The lines show the values of the Pearson Chi-Squared (dotted line), Bayesian Information Criterion (dashed line), and the Akaike Information Criterion (solid black line) fit indices as a function of number of latent classes. The vertical grey line indicates the number of latent classes in the chosen model (four).

