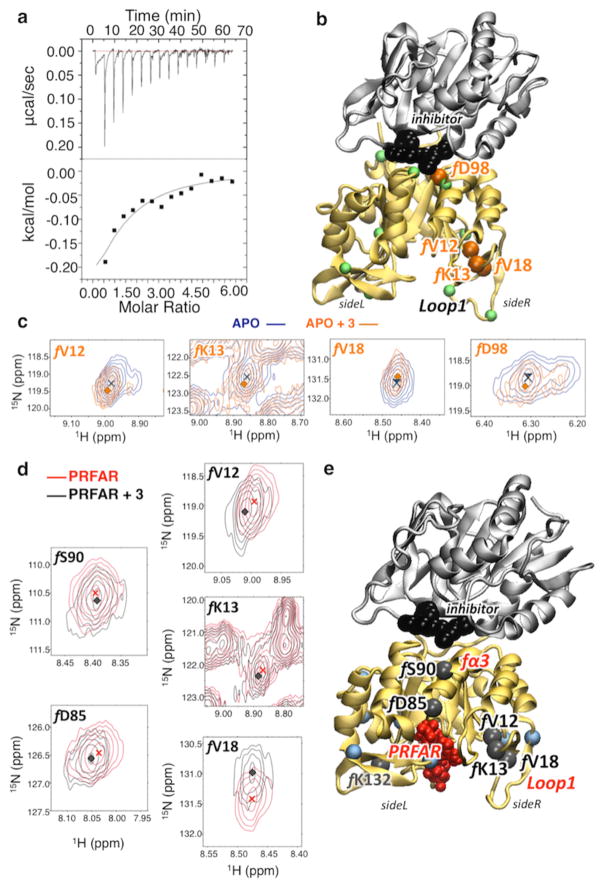
Figure 4.
Characterization of inhibitor binding by chemical shifts changes in apo- and effector-bound IGPS, induced upon inhibitor binding. (a) Raw (top) and integrated (bottom) calorimetric isotherm collected upon binding of 3 (12.4 mM) to apo IGPS (0.377 mM). (b and c) Correlation peaks (of selected residues mapped onto the structure of the 3–IGPS complex) from 1H–15N HSQC NMR experiments with 15N-labeled HisF-IGPS. Titration of 3 into apo IGPS (blue) at 3.17 mM (orange) causes distinct shifts and/or exchange broadening in several resonances. Residues with Δδ values of >0.1 (green spheres at Cα) are mapped onto the structure of the 3–IGPS complex, highlighting the four most affected resonances (orange spheres) with Δδ values of >0.14. (d and e) Analogous correlation peaks are shown for the binary IGPS complex, with a PRFAR concentration of 0.96 mM. Titration of 3 into binary PRFAR-bound IGPS (red) to a concentration of 9.4 mM (orange) causes distinct shifts in several resonances. Residues with Δδ values of >0.1 (blue spheres at Cα) are mapped onto the ternary IGPS structure (3 and PRFAR) (e), highlighting the six most affected resonances (black spheres) with Δδ values of >0.14.

