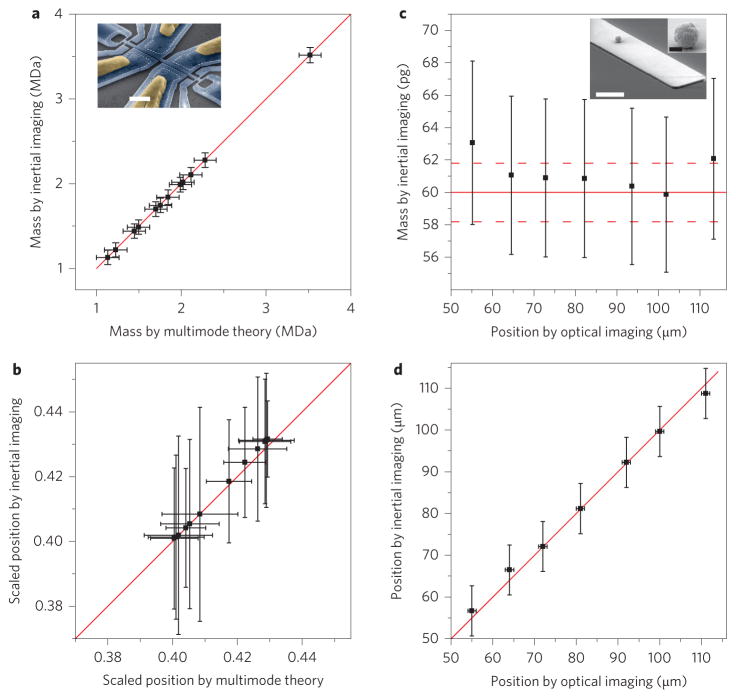
Figure 3. Mass and position analysis using published experimental data.
a,b, Mass (a) and position (b) calculations for the experimental data from ref. 7 using two modes of a doubly-clamped beam. The values for mass and position are compared with the previous values from ref. 7 using multimode theory. Position is scaled to the device length. Error bars in inertial imaging theory reflect the total error due to both the fitting residual and frequency fluctuations (2σ, 95% confidence level). c, Analysis of particle mass for different positions using the four-mode measurement of the same particle along a cantilever device16. The particle expected mass is estimated from the scanning electron microscopy (SEM) measurements of ref. 16 (solid red line) with 2% assumed uncertainties in that measurement (dotted red lines). d, Position calculation using the same data, compared with the optically measured position. Red lines in a,b,d represent curves of exact agreement between the two methods. Insets in a and c: Electron micrographs of representative devices used in the two respective studies. Scale bars, 2 μm (a); white, 5 μm and black, 500 nm (c). In all figures, error bars represent the 2σ, 95% confidence level.

