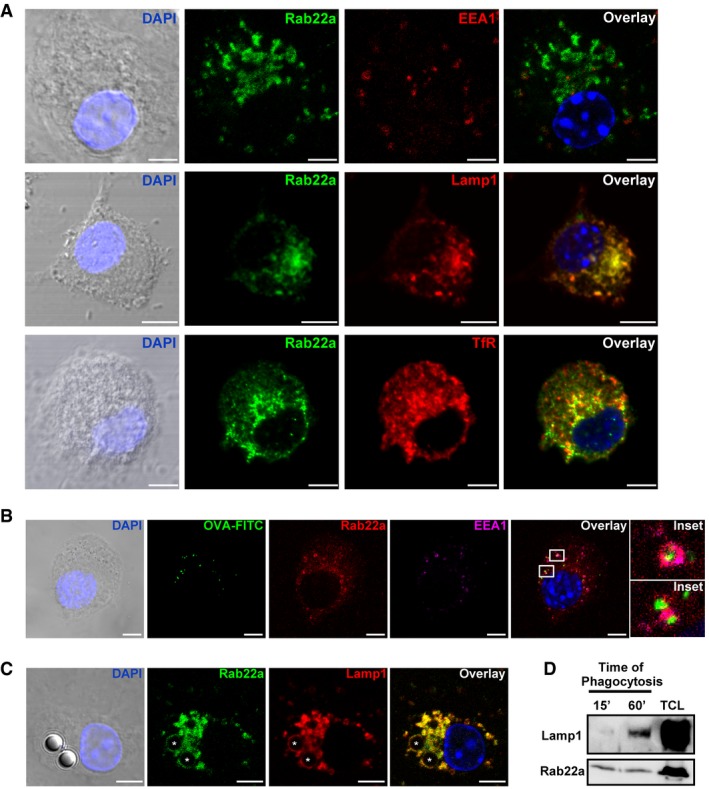
Confocal microscopy analysis showing the localization of endogenous Rab22a (green) and different endocytic markers (red): early endosomal marker EEA1, late endosome/lysosomal marker Lamp1, and the recycling compartment marker TfR in BMDCs at steady state. The means ± SEM of the Pearson correlation coefficients (Pcc) from Rab22a and EEA1 (0.4317 ± 0.05101), Lamp1 (0.8412 ± 0.03562), and TfR (0.6409 ± 0.02999) were estimated from 15 images analyzed for each marker. Scale bars: 5 μm.
Colocalization of endogenous Rab22a (red) and EEA1 (magenta) around endosomes containing fluorescent soluble OVA (OVA‐FITC, green) after 30 min of internalization by BMDCs. More than 60% of the endosomes were positive for Rab22a and EEA1. The indicated boxes are shown at higher magnification in the insets. Scale bars: 5 μm.
IF detection of endogenous Rab22a (green) and Lamp1 (red) after 1 h of phagocytosis of 3‐μm latex beads (LB) in BMDCs. Around 50% of the phagosomes were double positive for Rab22a and Lamp1. Asterisks indicate the LB. Scale bars: 5 μm.
BMDCs were incubated with 3‐μm magnetic beads for 15 min at 37°C and chased for 0 or 45 min. The panel shows immunoblotting of purified phagosomes, and the total cell lysates (TCL) analyzed for Lamp1 and Rab22a. A total protein amount of 10 μg and 50 μg was loaded for purified phagosomes and TCL, respectively. The blot is representative of three independent experiments.
Data information: In (A–C), the nuclear marker DAPI (blue) and DIC images are shown in the left panels. Overlays are shown in the right panels. Data are representative of three independent experiments.

