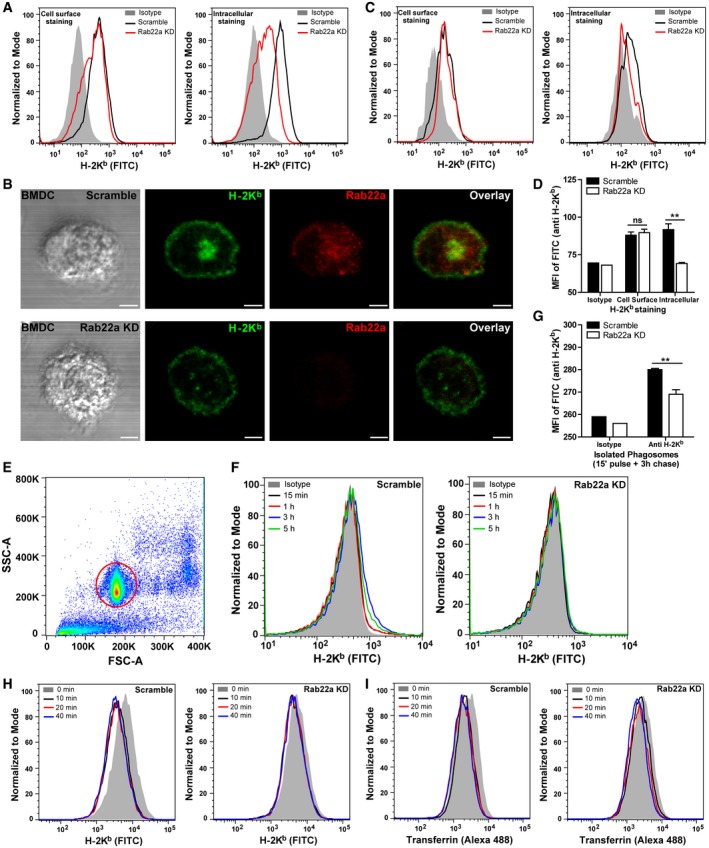
Representative FACS profile of intact (left panel) and saponin‐permeabilized (right panel) Scramble and Rab22a KD JAWS‐II DCs after H‐2Kb staining.
IF labeling and confocal microscopy analysis showing the distribution of MHC‐I molecules (H‐2Kb, green) and Rab22a (red) in Scramble and Rab22a KD BMDCs at steady state. DIC images are shown in the left panels. Overlay is shown in the right panels. Scale bars: 5 μm.
Representative FACS profiles of intact (left panel) and saponin‐permeabilized (right panel) Scramble and Rab22a KD BMDCs after H‐2Kb staining.
FACS analysis of MHC‐I labeled in intact (cell surface) and permeabilized (intracellular) Scramble and Rab22a KD BMDCs. Data represent mean ± SEM of triplicate values. P = 0.6283 (ns) and **P = 0.0046. The two‐tailed Student's unpaired t‐test was performed.
Representative dot plot obtained from flow cytometry analysis after the isolation of 3‐μm LB phagosomes. The population corresponding to individual phagosomes (red circle) is easily distinguished from the cellular debris generated after sample processing. More than ten thousand phagosomes from each condition were analyzed in each experiment.
Representative FACS profiles of H‐2Kb staining on isolated phagosomes at the indicated time periods after 3‐μm LB internalization by Scramble and Rab22a KD JAWS‐II DCs.
MHC‐I staining on isolated phagosomes was measured by FACS at 3 h post‐internalization of 3‐μm LB by Scramble and Rab22a KD BMDCs. Data represent mean ± SEM of triplicate values. **P = 0.0070. The two‐tailed Student's unpaired t‐test was performed.
Representative FACS profiles of MHC‐I molecules (H‐2Kb FITC) recycling at the indicated time periods by Scramble and Rab22a KD JAWS‐II DCs.
Representative FACS profiles of TfR (Alexa 488‐transferrin) recycling at the indicated time periods by Scramble and Rab22a KD JAWS‐II DCs.
Data information: For (A, E, F, H, and I), data are representative of three independent experiments. For (B–D and G), data are representative of two independent experiments.

