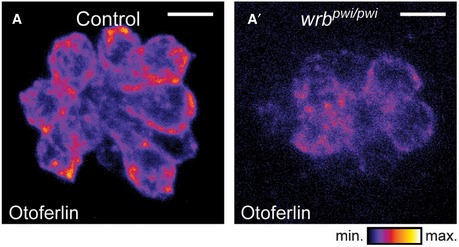
Figure EV1. Wrb dependence of otoferlin expression in HCs of zebrafish neuromasts (related to Fig 1).

-
A, A′Immunostaining of otoferlin in 5‐dpf zebrafish neuromasts, presented in an intensity‐coded LUT to illustrate the reduced otoferlin signal in wrb pwi/pwi compared to control fish. Scale bar: 5 μm.
