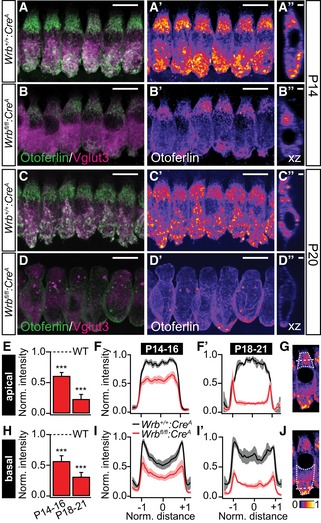
Figure 4. Wrb disruption in mouse IHCs greatly reduced otoferlin levels.

-
A–D″Representative maximum projections of confocal sections of (A–B″) P14 and (C–D″) P20 Wrb +/+:Cre A and Wrb fl/fl:Cre A apical turn organs of Corti following immunolabeling against otoferlin (green) and Vglut3 (magenta) processed and imaged under identical conditions. Panels (A′, B′, C′, and D′) show individual otoferlin stainings with an intensity‐coded lookup table. Panels (A″, B″, C″, and D″) present single xz projections at a central point through a representative IHC to illustrate otoferlin subcellular distribution. Scale bars in (A, A′, B, B′, C, C′, D, D′) represent 10 μm, in (A″, B″, C″, D″) 2 μm. Note the dramatic reduction in otoferlin fluorescence and the alteration in its distribution as well as a change in cell shape and position of nuclei (for detailed analysis of cell shape and nuclei position, please refer to Fig EV5).
-
E–GSemiquantitative analysis of otoferlin immunofluorescence in the apical parts of IHCs from Wrb fl/fl:Cre A mice using averaged regions of interests in cell's maximal projections (outlined with a dotted line in G for a single representative IHC) normalized to the maximum values observed in the respective control IHCs. Averaged supranuclear coronal line profiles, as illustrated with a dashed line in (G), are shown for (F) P14–16 and (F′) P18‐21 IHCs. ***P < 0.001 versus Wrb +/+:Cre A.
-
H–JSemiquantitative analysis of otoferlin immunofluorescence in the basal parts of IHCs from Wrb fl/fl:Cre A mice using averaged regions of interests in cell's maximal projections (outlined with a dotted line in J for a single representative IHC) normalized to the maximum values observed in the respective control IHCs. Averaged supranuclear coronal line profiles, as illustrated with a dashed line in (J), are shown for (I) P14–16 and (I′) P18–21 IHCs. ***P < 0.001 versus Wrb +/+:Cre A.
