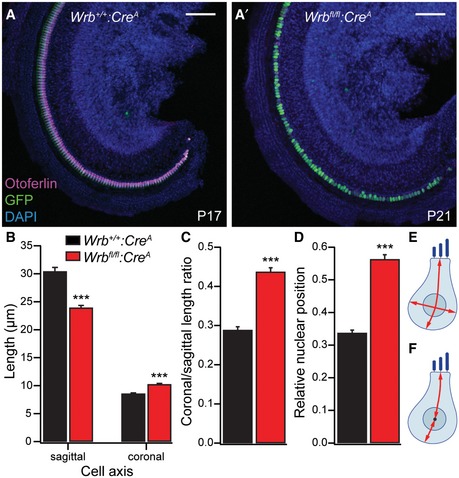
Figure EV5. Wrb disruption affects IHC morphology.

-
A, A′Representative low‐magnification (10×) confocal projections of apical turn whole‐mount organs of Corti from Wrb +/+:Cre A P17 (A, same specimen as shown in Appendix Fig S4) and Wrb fl/fl:Cre A P21 (A′) animals immunolabeled for GFP (green, reporting Cre recombination), otoferlin (magenta, labeling IHCs), and DAPI (blue, labeling all cell nuclei). Scale bar: 100 μm. Note that Wrb deficiency does not lead to a dramatic loss of IHCs, but a change in IHC morphology. Cell shape and nuclear position were analyzed in images taken with higher magnification (63×, see Fig 4).
-
B, CWrb‐deficient IHCs (P18–21) show significantly decreased sagittal, but increased coronal extent (Wilcoxon rank test, ***P < 0.001), resulting in an increased ratio of these two measurements (Wilcoxon rank test, ***P < 10−15, n = 46 and 67 Wrb‐deficient and control IHCs from four and six P18–21 Wrb +/+:Cre A and Wrb fl/fl:Cre A animals, respectively). Custom‐written MATLAB routines were used for the analysis. Data are represented as means ± SEM.
-
DNuclear position is altered in Wrb fl/fl:Cre A animals, where nuclei are located closer to the cell base as compared to controls. The relative distance from the apical plane of a cell is given. Data are represented as means ± SEM.
-
E, FSchematic drawings illustrating the analysis performed in (B–D).
