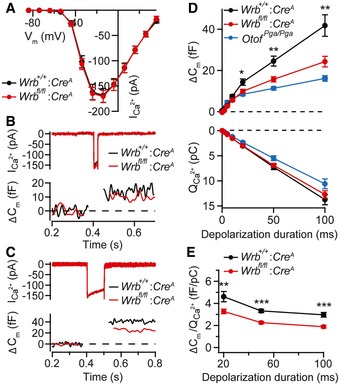
Figure 6. Impaired sustained exocytosis in Wrb‐deficient IHCs.

- Ca2+ current–voltage relationship of P14–P17 IHCs of Wrb fl/fl:Cre A (n = 17 IHCs) and Wrb +/+:Cre A (n = 15 IHCs) mice in 2 mM extracellular [Ca2+] showed no change in amplitude or voltage dependence of Ca2+ currents. Data are represented as means ± SEM.
- Representative Ca2+ current (top) and Cm changes (bottom) in Wrb fl/fl:Cre A and Wrb +/+:Cre A IHCs in response to 20‐ms step depolarizations to −14 mV (the potential eliciting the maximum Ca2+ current).
- Representative Ca2+ current (top) and Cm changes (bottom, finite impulse response filtered) in Wrb fl/fl:Cre A and Wrb +/+:Cre A IHCs in response to 100‐ms step depolarizations to −14 mV.
- Exocytic ΔCm (top) and corresponding Ca2+ current integrals, QCa (bottom) for various depolarization durations. Data are grand averages of the cells' means. Exocytic ΔCm was reduced in the knockout from 20 ms onwards, indicating reduced sustained exocytosis. Data from Otof Pga/Pga animals were replotted for direct comparison from Pangrsic et al (2010). Data represent means ± SEM; *P < 0.05; **P < 0.01.
- ΔCm/QCa2+ ratio indicates a lower efficacy of Ca2+ influx in driving exocytosis in Wrb fl/fl:Cre A IHCs, for stimuli of 20 ms or longer. Data represent means ± SEM; **P < 0.01; ***P < 0.001.
