-
A
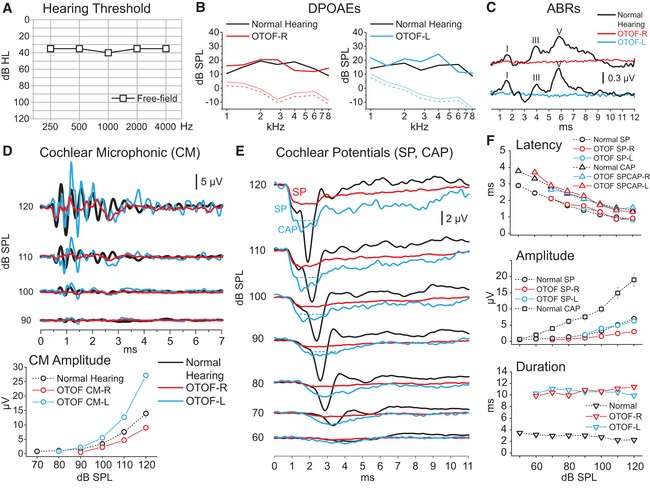
Visual reinforcement audiometry performed in the free field: a mild hearing loss.
-
B, C
Distortion product otoacoustic emissions (DPOAEs, B) were detected in each ear, whereas auditory brainstem responses (ABR, C) were lacking, together providing the signature of auditory synaptopathy or neuropathy.
-
D, E
Cochlear microphonic potentials (CM), summating potential (SP), and compound action potential (CAP) recorded through transtympanic electrocochleography (ECochG) in response to clicks at decreasing stimulus intensities are superimposed on the corresponding potentials recorded from one normally hearing control. CM amplitudes were within normal limits (range as measured at 120 dB 4.31–28.02 μV in 20 normally hearing children). The ECochG waveform resulting from CM cancellation in the control begins with an abrupt negative deflection, the SP, followed by a negative peak, the neural CAP. In the child with the OTOF TMD mutation, the ECochG responses begin with a rapid negative deflection that peaks at the same latency as the SP in the control and has comparable amplitude. This is followed by a low‐amplitude negative potential that peaks at the same CAP in controls but shows a markedly prolonged duration. In all graphs, time “0” refers to CM onset. R: right, L: left.
-
F
Means and standard errors of peak latency and amplitude are reported for each potential category.

