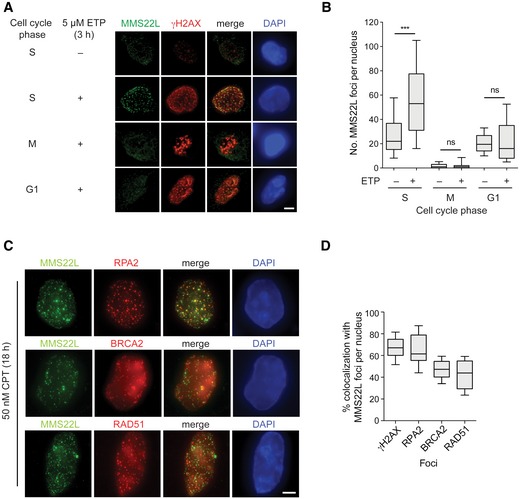
Immunofluorescence images of MMS22L foci formation at etoposide (ETP)‐induced DSBs during S, M, and G1 phases of the cell cycle in HeLa cells. Scale bar: 5 μm.
Quantification of a representative experiment from (A) shows number of MMS22L foci per nucleus during indicated cell cycle phases (n = 2; n
nuclei ≥ 60).
Immunofluorescence images of CPT‐induced MMS22L, RPA2, BRCA2, and RAD51 foci in U2OS cells. Scale bar: 5 μm.
Quantification of a representative experiment (n = 3) from (C) shows percentage of γH2AX, RPA2, BRCA2, and RAD51 foci colocalizing with MMS22L foci (n
nuclei = 30; nuclei with ≥ 25 MMS22L foci were analyzed).
Data information: Boxplots in (B and D) represent distributions per nucleus; boxes indicate the 25–75 percentile and whiskers the 10–90 percentile. Horizontal lines mark the medians. Statistical analysis: Mann–Whitney
U‐test; ***
P ≤ 0.0001; ns, not significant.