-
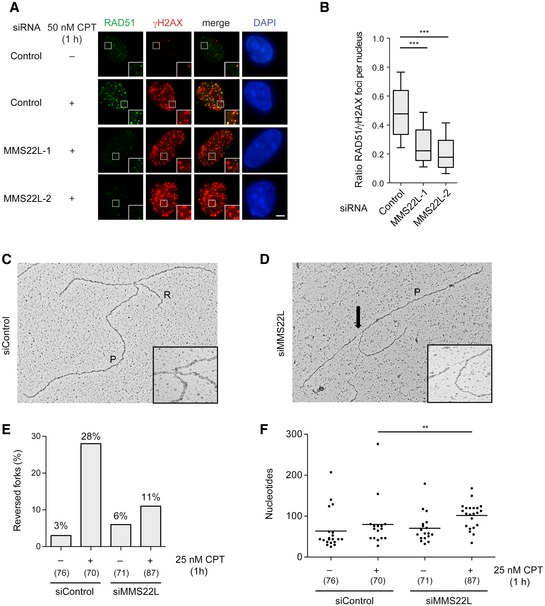
A
Representative immunofluorescence images of foci induced by short CPT treatment (50 nM, 1 h) in U2OS cells treated with indicated siRNAs showing the effect of MMS22L depletion on the RAD51 foci. Scale bar: 5 μm.
-
B
Boxplot quantification of representative experiment in (A) (n = 3; n
nuclei ≥ 78). Boxes indicate the 25–75 percentile and whiskers the 10–90 percentile; horizontal lines mark the medians. Nuclei with ≥ 25 γH2AX foci (marker of replication stress sites) were analyzed. Statistical analysis: Mann–Whitney U‐test; ***P ≤ 0.0001.
-
C, D
Electron micrographs of a representative reversed fork (C) and a fork with extended ssDNA region at the junction (D) (arrow). P, parental duplex; R, regressed arm.
-
E
Frequency of reversed replication forks detected by EM. Similar results were obtained in one independent experiment (n = 2). In brackets, the total number of analyzed molecules is given.
-
F
Distribution of ssDNA length at replication forks isolated from U2OS cells transfected with the indicated siRNAs and treated with 25 nM CPT for 1 h. In brackets, the total number of analyzed molecules is given. Statistical analysis according to Mann–Whitney U‐test; **P ≤ 0.01, n = 2.