
Figure EV5. Analysis of biological alterations in CAMDI‐KO brain relevant to psychiatric disorders.
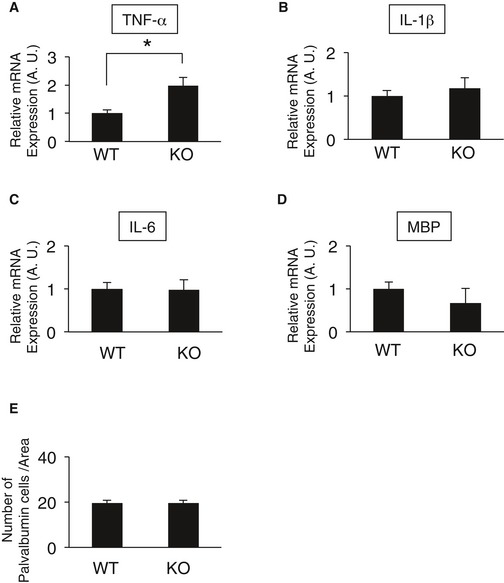
- Real‐time PCR quantification of the transcript for TNF‐α. n = 3 mice/genotype. *P < 0.05; one‐way ANOVA with Bonferroni's post hoc test. Data are presented as mean ± SEM.
- Real‐time PCR quantification of the transcript for IL‐1β. n = 3 mice/genotype. One‐way ANOVA with Bonferroni's post hoc test. Data are presented as mean ± SEM.
- Real‐time PCR quantification of the transcript for IL‐6. n = 3 mice/genotype. One‐way ANOVA with Bonferroni's post hoc test. Data are presented as mean ± SEM.
- Real‐time PCR quantification of the transcript for MBP (myelin basic protein). n = 3 mice/genotype. One‐way ANOVA with Bonferroni's post hoc test. Data are presented as mean ± SEM.
- Quantification of the number of Parvalbumin‐positive neurons. Note the abnormal distribution of neurons in deep cortical layers of CAMDI‐KO mice. n = 3 mice/genotype (WT = 816 cells, KO = 438 cells). One‐way ANOVA with Bonferroni's post hoc test. Data are presented as mean ± SEM.