Figure 1.

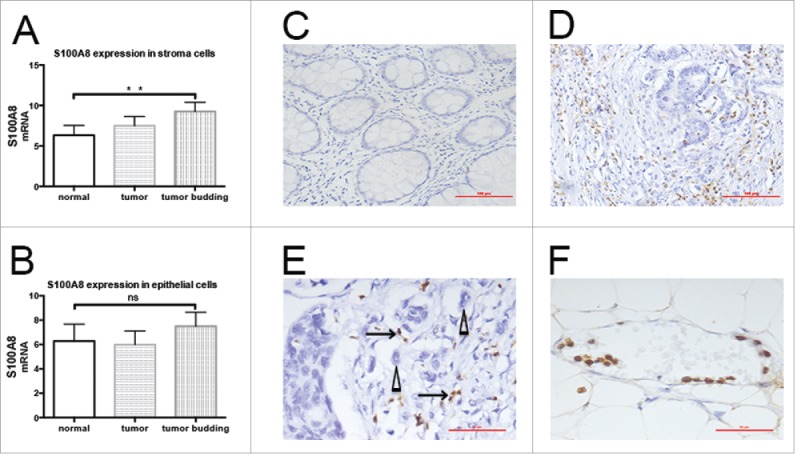
Distribution of S100A8+ cells in CRC tissues. A, S100A8 expression in stroma cells surrounding normal epithelial cells (p = 0.042) and tumor cells (p = 0.0048) was lower than in those surrounding tumor budding cells. B, S100A8 expression did not differ among normal epithelia, tumor cells, and tumor budding cells. C, S100A8+ cells in normal epithelial stroma (20×), scale bar: 100μm. D, S100A8+ cells (brown) in the tumor invasive front (20×), scale bar: 100μm; E, S100A8+ cells (arrow) distributed around tumor budding (triangle) (40×), scale bar: 50μm; tumor buddings are defined as comprising five tumor cells or less, appearing at the invasive front of a subset of colorectal adenocarcinomas of tiny cords of neoplastic epithelium that extend from the neoplastic glands into the adjacent stroma, and small aggregates of neoplastic epithelium that appear to have detached and migrated a short distance into a usually quite desmoplastic stroma; Patients parameters: TNM III, lymphonde metastasis, metastasis and vessel infiltration positive. F, S100A8+ cell-marginated vessels (40×), scale bar: 50μm; Patients parameters: TNM II, lymphonde metastasis, metastasis and vessel infiltration negative.
