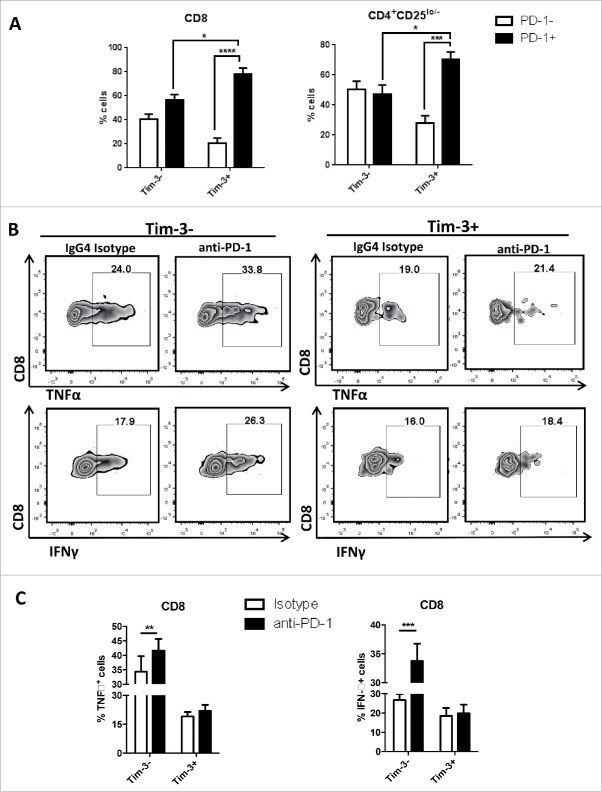
Figure 3.
PD-1 blockade induced upregulation of IFNγ and TNF-α expression are mostly seen in Tim-3- cells. Freshly isolated tumor-infiltrating lymphocytes from HNSCC patient were treated with anti-PD-1 mAb—Nivolumab and IgG4 as an isotype control. All treatments were given at the concentration of 10 µg/mL in vitro for 48 h. Anti-CD3/CD28 beads and protein transport inhibitor (BD GolgiPlug™) were added according to manufacture's instruction at least 6 h of cell culture for cytokine detection. Cytokine expressions were assessed by flow cytometry. (A) Summary data of baseline PD-1 expression in Tim-3+ and Tim-3- subsets.(n = 5) (B) Flow plot of IFNγ, TNFα expression in Tim-3+ and Tim-3− subsets. (C) Summary data of IFNγ, TNFα expression in Tim-3− and Tim-3+ subsets. (n = 5) All data represent average ± SEM. Significance were calculated by two-way ANOVA, *p < 0.05, **p < 0.001.

