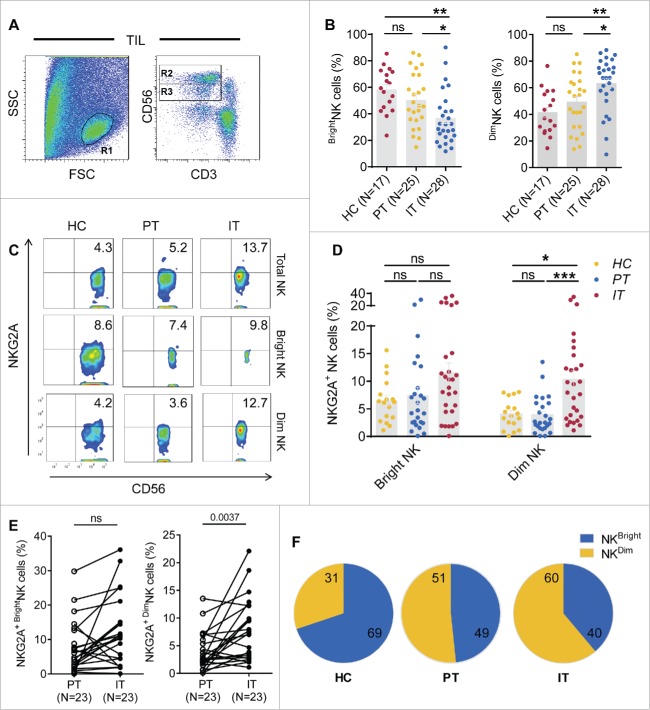
Figure 6.
NKG2A expression is mainly increased in intratumor CD56dim NK cells from HCC patients. (A) The gating strategy for TIL used to analyze the CD56bright NK cells and CD56dim NK cells via flow cytometry. (B) The percentages of CD56bright NK cells and CD56dim NK cells from healthy livers (N = 17) and the IT (N = 28) and PT (N = 25) regions of HCC patients (Kruskal–Wallis ANOVA followed by Dunn's multiple comparisons test). (C) Representative NKG2A expression in different liver NK cell subsets from healthy controls (left) and intratumor (right) and PT from HCC patients (middle). (D) Cumulative data on the percentages of NKG2A+ CD56bright NK cells (left) and NKG2A+ CD56dim NK cells (right) from healthy livers (N = 17) and intratumor (N = 28) and PT (N = 25) from HCC patients (Kruskal–Wallis ANOVA followed by Dunn's multiple comparisons test). (E) The percentages of NKG2A+ CD56bright NK cells (left) and NKG2A+ CD56dim NK cells (right) in paired central tumor and PT from each HCC patient. (F) The proportion of NKG2A+ CD56bright NK cells (yellow) and NKG2A+ CD56dim NK cells (blue) among the total NKG2A+ NK cells from intratumor regions (right), PT (middle) and healthy livers (left).

