Figure 1.
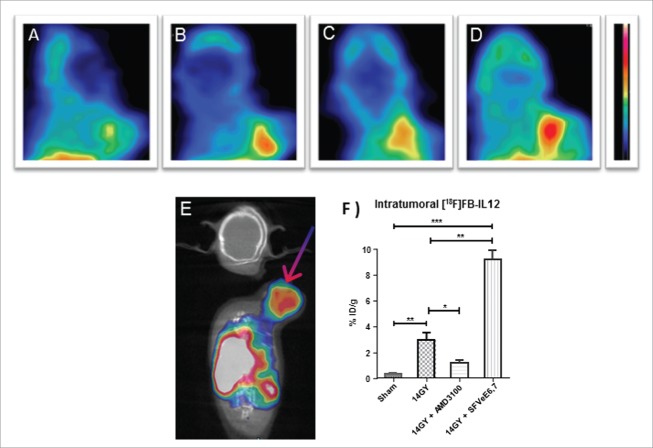
In vivo PET imaging and quantitative uptake of [18F]FB-IL-2 in TC-1 tumors. Representative cross-sectional images of TC-1 tumor-bearing mice with the tumor in the field of view. Mice were subjected to different treatments: (A) sham-irradiation (control), (B) 14 Gy local tumor irradiation, (C) 14 Gy local tumor irradiation followed by administration of the CXCR4 antagonist AMD3100 or (D) 14 Gy local tumor irradiation followed by immunization with 5 × 10⁶ SFVeE6,7 particles. (E) Representative a fused PET and computer tomography (CT) image of a cross-section of a TC-1 tumor bearing mouse treated with 14 Gy local tumor irradiation followed by immunization with SFVeE6,7 particles. (F) Quantitative estimation of the in vivo tracer uptake, expressed as percentage of the injected tracer dose per gram of tissue (%ID/g). Arrow indicates the position of the tumor, and all the data represent the mean ± standard deviation. Statistically significant differences between groups are indicated by *p < 0.05, **p < 0.01, and ***p < 0.001.

