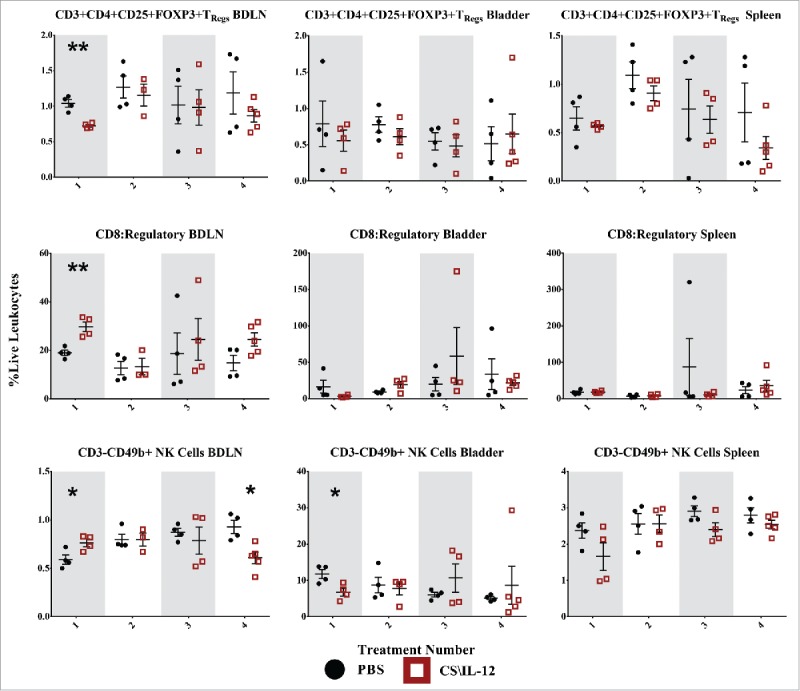
Figure 7.

Regulatory T-cell and natural killer cell infiltration by treatment number and tissue. Mice were implanted with 75,000 MB49 cells in the bladder and given 1, 2, 3, or 4 intravesical treatments with CS/IL-12 or PBS on days 7, 11, 15, and 18, respectively (n = 4–5 per group). Bladder draining lymph nodes (BDLNs), bladders, and spleens were harvested 24 h after each treatment and analyzed via flow cytometry. Error bars indicate mean with SEM. Asterisks indicate significant differences between PBS and CS/IL-12 treatment groups at the same treatment number by Student's t-test: **p < 0.005.
