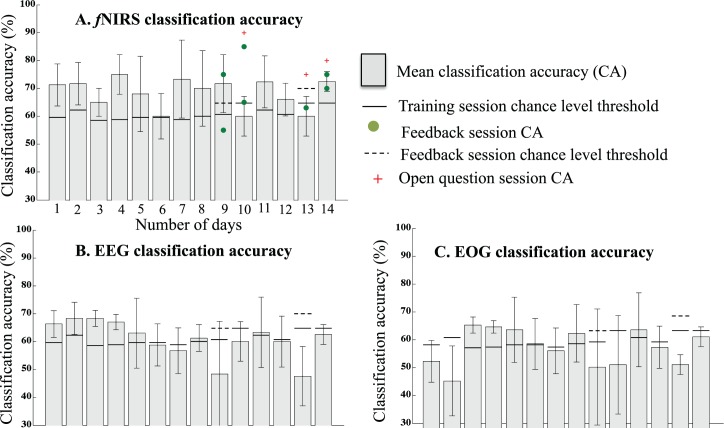
Fig 2. Classification accuracy of Patient F.
Linear SVM CA across “training sessions—offline CA” (histogram in grey), “feedback sessions—online CA” (green dot), and “open question session—online CA” (plus sign in red), obtained using (A) relative change in O2Hb, (B) EEG, and (C) EOG data. The classification accuracy reported here is daywise, as all the “training sessions” in a day were used to calculate the average classification accuracy of all the “training sessions” in a day. In the figure panels A, B, and C, the x-axis is the number of days and the y-axis is the classification accuracy. The solid black and dotted horizontal lines represent the chance-level threshold calculated using the metric described in the BCI effectiveness metric section for “training sessions” and “feedback sessions,” respectively. Since the feedback during the feedback and open question sessions was provided using the O2Hb, the online CA of the feedback and open question sessions is reported only for the fNIRS data. Fig 2 data is located at https://doi.org/10.5281/zenodo.191884.

