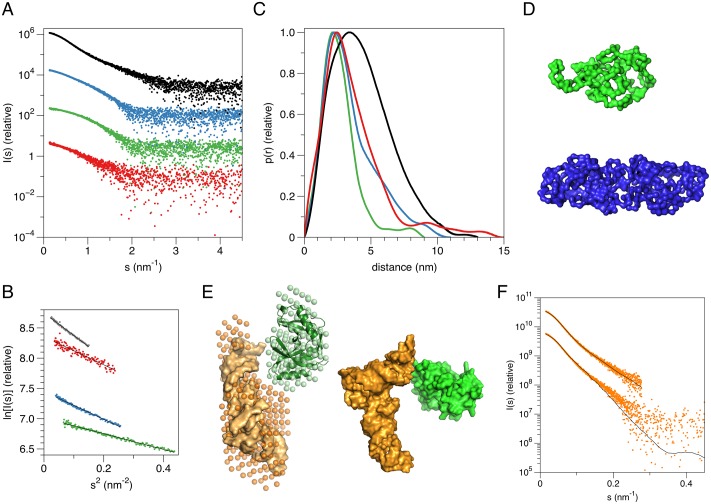
Fig 6. SAXS analysis of LigT.
A. Scattering curves of LigT (green), dimeric LigT (blue), yeast tRNA (red), and the LigT-tRNA complex (black). The curves have been vertically displaced for easier viewing. B. Guinier plots of all samples indicate clear lack of aggregation. Plots are shown for 0.5 < sRg < 1.3 for each sample. C. Distance distributions. Note the clear shift of the main peak in the complex sample, indicative of complex formation. D. SAXS-based models of monomeric LigT (top, green) and dimeric LigT (middle, blue). E. Models for the LigT-tRNA complex. Left: The MONSA model is shown as spheres (LigT, green; tRNA, orange), and the crystal structures of LigT and tRNA (PDB entry 2TRA [28]) are superimposed on the model. Right: SASREF rigid body model with the same colouring. Fitting parameters of the models are given in Table 2. F. Fit of the complex models in panel E to the experimental data. Top, MONSA; bottom, SASREF.

