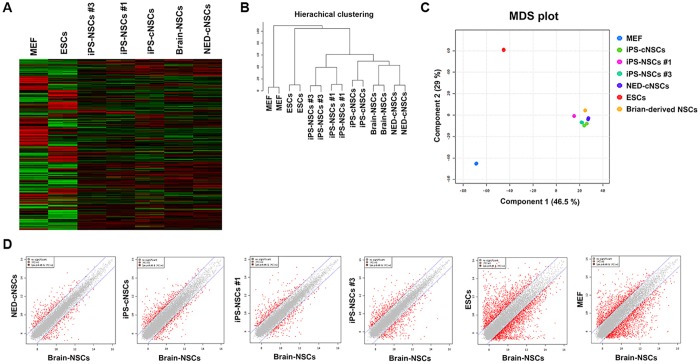
Fig 2. Gene-expression pattern of iPS-derived NSCs, in vitro and in vivo.
(A) Heatmap analysis of MEFs, ESCs, iPS-NSCs (#1 and #3), iPSC-cNSCs, brain-derived NSCs, and NED-cNSCs. (B) Hierarchical clustering analysis of MEFs, ESCs, iPS-NSCs (#1 and #3), iPSC-cNSCs, brain-derived NSCs, and NED-cNSCs. (C–D) MDS and scatter-plot analysis of MEFs, ESCs, iPS-NSCs (#1 and #2), iPSC-cNSCs, brain-derived NSCs, and NED-cNSCs.

