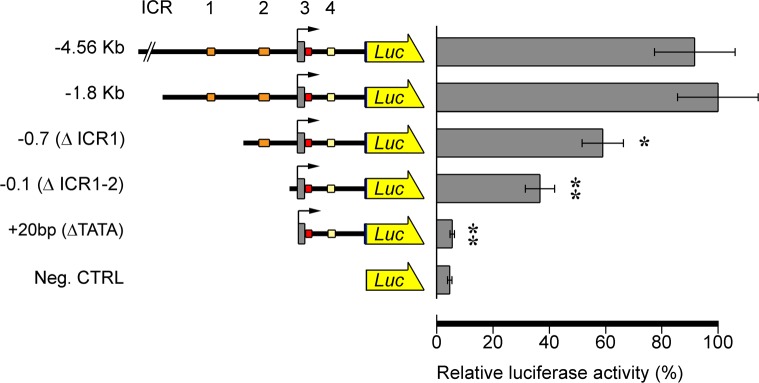
Fig 3. Enhancer functions of ICR1 and ICR2.
Upstream deletions: luciferase activity progressively decreases after ICR1 and ICR2 sequential deletions. Left: schematic pictures of luciferase reporter constructs. Structure and conventions are the same as in Fig 1, except that the arrowed yellow box represents the Luc reporter gene. Right: luciferase activity measured at gastrula stage (24 hours post fertilization-hpf). The activity of the -1.8KbLuc construct is defined as 100%. Data are expressed as means ± standard deviation (SD) of triplet measurements of at least three independent experiments. Asterisks denote statistical significance: ** P value ≤ 0.0021, * P value = 0.0122.

